How to use ARC IDE
MetaWare Development Toolkit
Purpose
- To learn MetaWare Development Toolkit
- To get familiar with the basic usage of the MetaWare Development Toolkit
- To get familiar with the features and usage of the MetaWare Debugger (mdb)
Requirements
The following hardware and tools are required:
- PC host
- MetaWare Development Toolkit
- nSIM simulator or ARC board (EM Starter Kit / IoT Development Kit)
embarc_osp/arc_labs/labs/lab_core_test
Content
- Create a C project using the MetaWare Development Toolkit
- Import the code
CoreTest.cfromembarc_osp/arc_labs/labs/lab_core_test - Configure compilation options to compile, and generate executable files.
- Start the debugger of MetaWare Development Toolkit and enter debug mode.
From two different perspectives of C language and assembly language, use the methods of setting breakpoint, single-step execution, full-speed executions, etc., combined with observing PC address, register status, global variable status, and profiling performance to analyze and debug the target program.
Principles
Use the MetaWare Development Toolkit to create projects and load code. In the engineering unit, configure the compilation options to compile code, debug, and analyze the compiled executable file.
Routine code CoreTest.c:
/////////////////////////////////////////////////////////////////////////
// This small demo program finds the data point that is the
// minimal distance from x and y [here arbitrarily defined to be (4,5)]
//
// #define/undefine '_DEBUG' precompiler variable to obtain
// desired functionality. Including _DEBUG will bring in the
// I/O library to print results of the search.
//
// For purposes of simplicity, the data points used in the computations
// are hardcoded into the POINTX and POINTY constant values below
/////////////////////////////////////////////////////////////////////////


#ifdef _DEBUG
#include "stdio.h"
#endif

#define POINTX {1, 2, 3, 4,  5,  6,  7,  8,  9, 10}
#define POINTY {2, 4, 6, 8, 10, 12, 14, 16, 18, 20}
#define POINTS 10

#define GetError(x, y, Px, Py) \
    ( (x-Px)*(x-Px) + (y-Py)*(y-Py) )

int main(int argc, char* argv[]) {
    int pPointX[] = POINTX;
    int pPointY[] = POINTY;

    int x, y;
    int index, error, minindex, minerror;

    x = 4;
    y = 5;

    minerror = GetError(x, y, pPointX[0], pPointY[0]);
    minindex = 0;

    for(index = 1; index < POINTS; index++) {
            error = GetError(x, y, pPointX[index], pPointY[index]);

            if (error < minerror) {
                    minerror = error;
                    minindex = index;
            }
        }

#ifdef _DEBUG
    printf("minindex = %d, minerror = %d.\n", minindex, minerror);
    printf("The point is (%d, %d).\n", pPointX[minindex], pPointY[minindex]);
    getchar();
#endif

    return 0;
    }
Steps
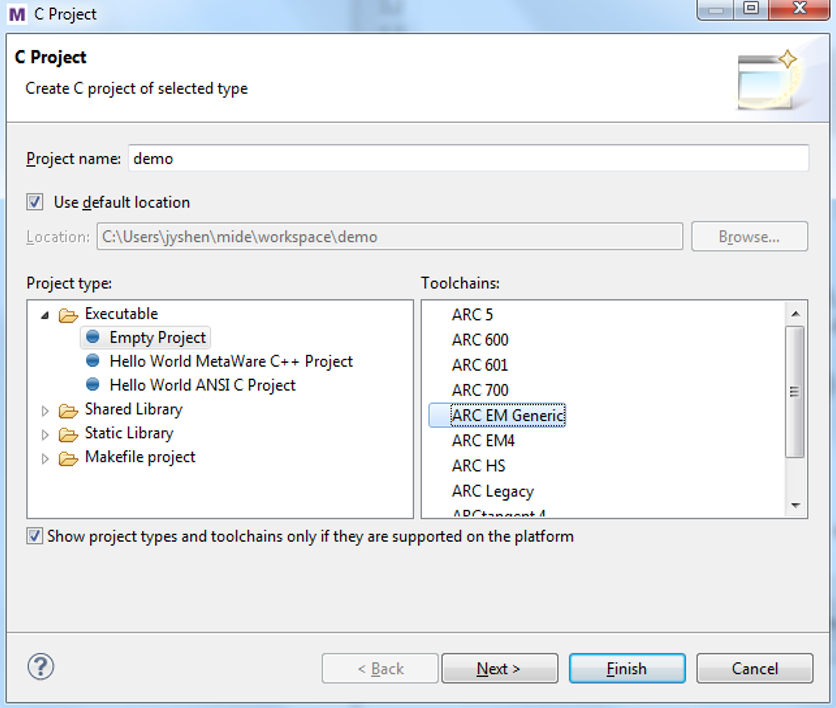
- Create a project
Open the MetaWare Development Toolkit, create an empty project called demo, and select the ARC EM Generic processor.
- Import the code file CoreTest.c to the project demo.
In the Project Explorer, click  and select Import.
In the Implort wizard, select File system from the General tab, then click Next. As shown in the following figure, in the From directory fileld, type or browse to select the directory contain the file CoreTest.c. Recent directories that have been imported from are shown on the From directory field’s combo box. In the left pane, check a folder that will import its entire contents into the Workbench, and in the right pane check the file CoreTest.c.
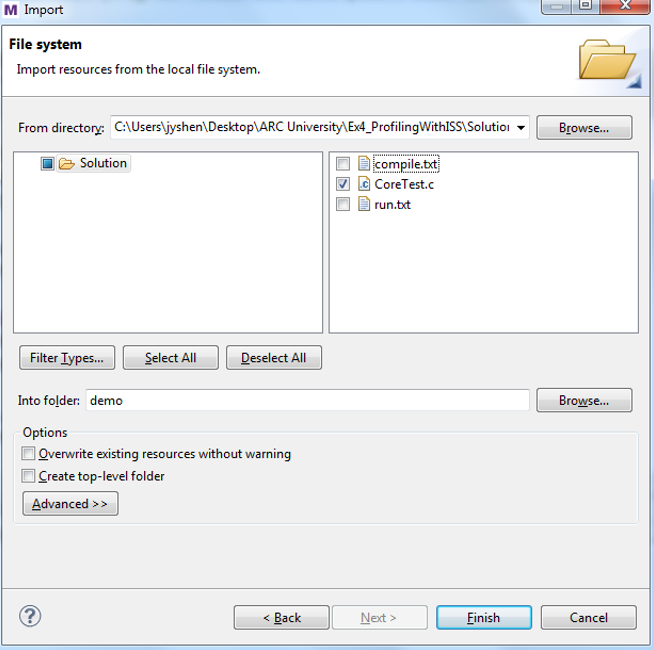
Click Finish when done, the file CoreTest.c is now shown in the one of the navigation views in the project demo.
- Set compilation options
From the Project Explorer view, right-click the project demo and choose Properties. Click C/C++ Build > Settings > Tool Settings menu options.
The Tool Settings dialog opens.
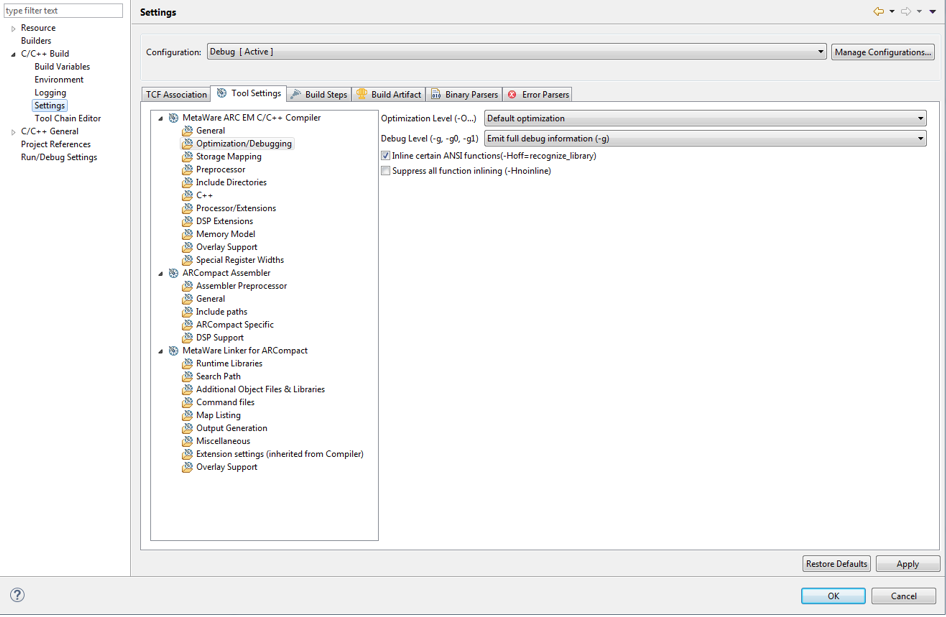
Select Optimization/Debugging to set the compiler optimization and debugging level. For example, set the optimization level to turn off optimization, and set the debugging level to load all debugging information.
Select Processor/Extensions to set the compilation options corresponding to the target processor hardware properties, such as the version of the processor, whether to support extended instructions such as shift, multiplication, floating-point operations, and so on whether to include Timer0/1. As shown in the following figure, this setting indicates that the target processor supports common extended instructions.
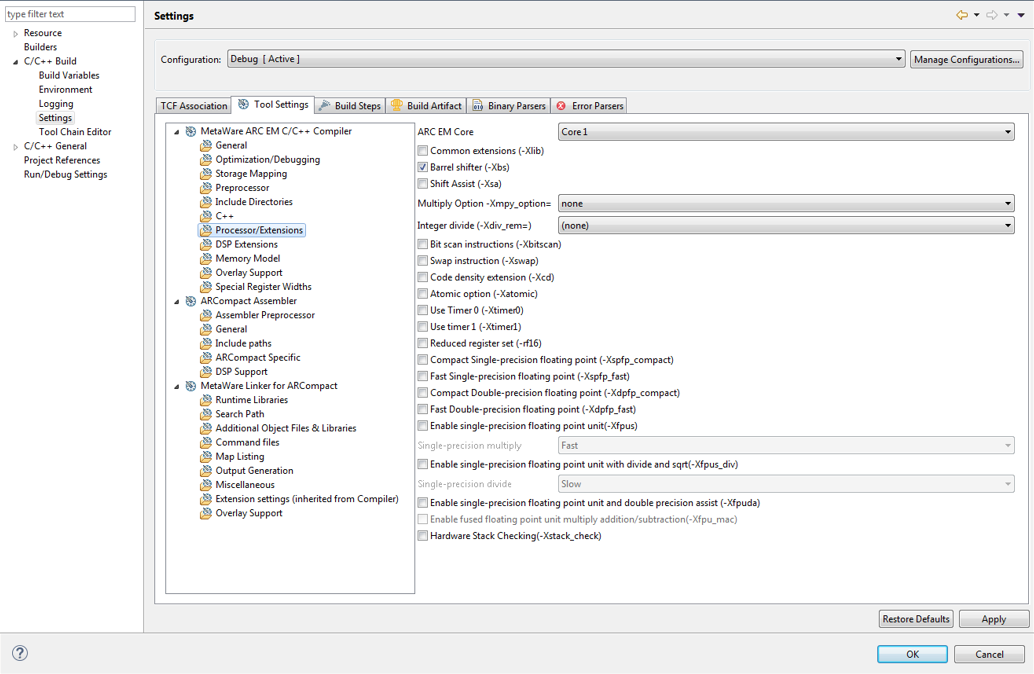
Select MetaWare ARC EM C/C++ and check the settings compilation options. Click OK when done.
- Build project
In the Project Explorer view, select project demo.
Click Project > Build Project or click the icon  on the toolbar.
In the MetaWare Development Toolkit main interface, you can see in the Console view the output and results of the build command. Click on its tab to bring the view forward if it is not currently visible. If for some reason it’s not present, you can open it by selecting Window > Show View > Console. When the message
on the toolbar.
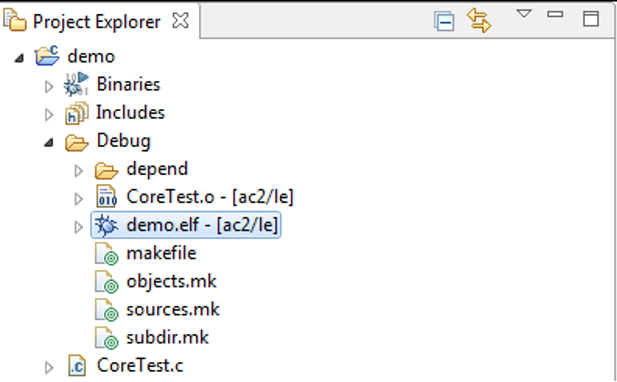
In the MetaWare Development Toolkit main interface, you can see in the Console view the output and results of the build command. Click on its tab to bring the view forward if it is not currently visible. If for some reason it’s not present, you can open it by selecting Window > Show View > Console. When the message Finished building target: demo.elf is displayed, the compilation is successful, and the compiled executable file demo.elf can be seen in the Project Explorer.
- Set debug options
Click the Run > Debug Configurations… menu option to open the Debug Configurations dialog. Double-click C/C++ Application or right-click New to create a new launch configuration.
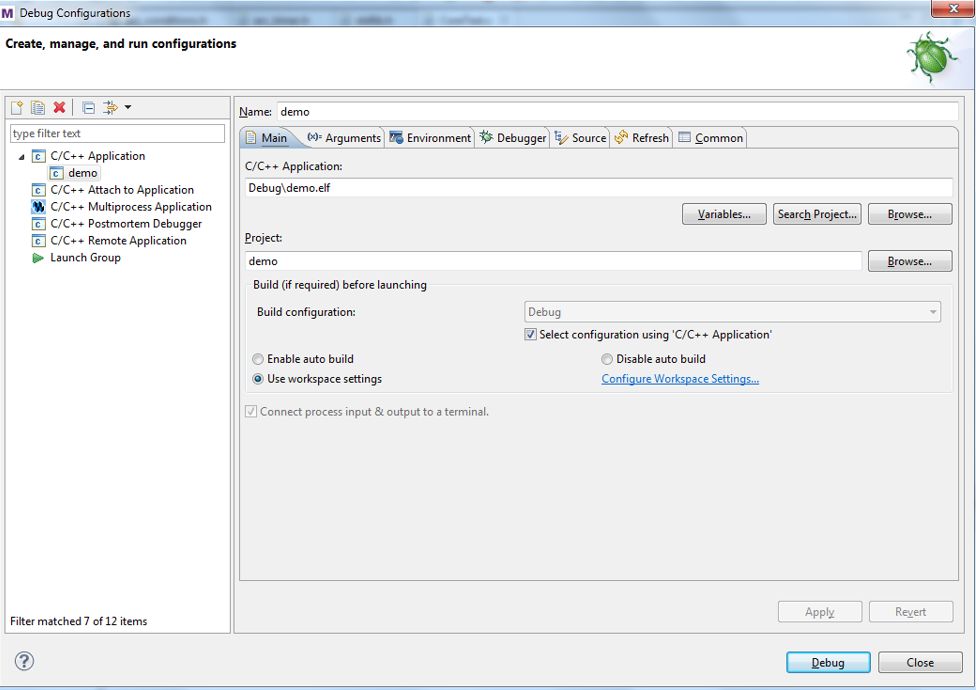
If a project is selected in the Project Explorer view all data is automatically entered, take a moment to verify its accuracy or change as needed. Here you do not need to make any changes, just click Debug to enter the debugging interface.
- Debug executable file demo.elf
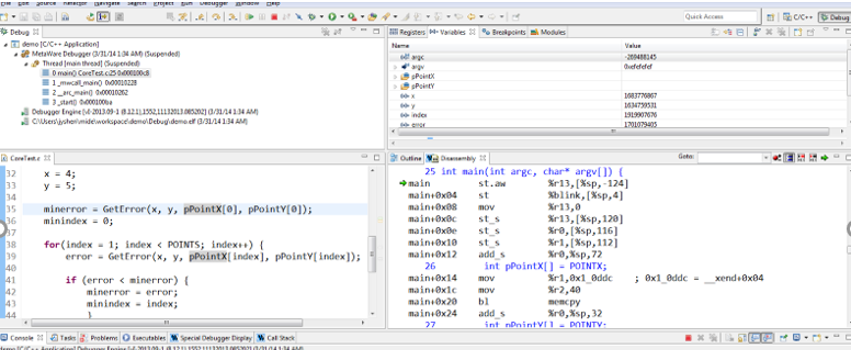
You may be prompted to switch to the Debug perspective. Click Yes.
The Debug perspective appears with the required windows open. And the windows can be source code window, assembly code window, register window, global variable window, breakpoint window, function window, and so on.
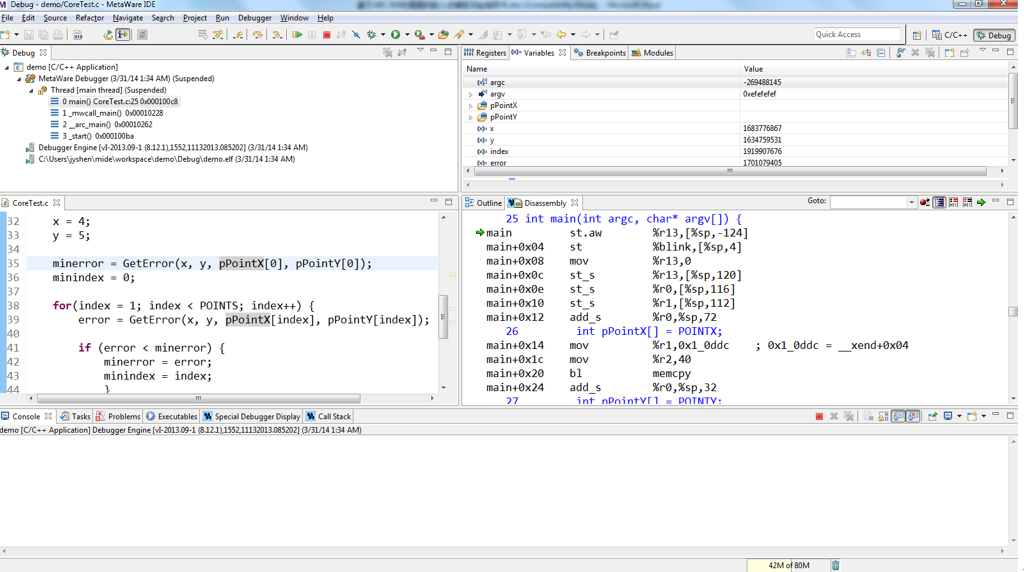
In the C code window, right-click the code line number on the left side of the window, select Toggle Breakpoint or double-click the line number to set a breakpoint on. In the assembly code window, double-click a line of code to set a breakpoint on. You’ll see a blue circle there indicating the breakpoint is set.
After the breakpoint is set, click Run > Resume or you can use the Resume button  on the toolbar of the Debug view to run the program. The program runs directly to the nearest breakpoint. You can observe the current program execution and the relevant status information of the processor through the various windows as described in previous step. If you want to know more about the details of program execution and the instruction behavior of the processor, you can use the following three execution commands
  to perform single-step debugging. The icon
  can choose to step through a C language statement or an assembly instruction to match the status information of each window. It can be very convenient for program debugging. If you want to end the current debugging process, click
  . If you want to return to the main MetaWare Development Toolkit page, click C/C++
  .
.
- Code performance analysis using the debugger
Based on the previous project demo, open the Compile Options dialog box in step 3 and set the Optimization Level to -O0 in the Optimization/Debugging column. Then click  to recompile the project, and click
  to enter the debugging interface. Click Debugger in the main menu of the debugging interface, select Disassembly from the menu drop-down menu, open the disassembly code window, and you can see that the program is paused at the entrance of the main() function. In the same way, select Profiling in the Debugger drop-down menu, open the performance analysis window and click
  .
.
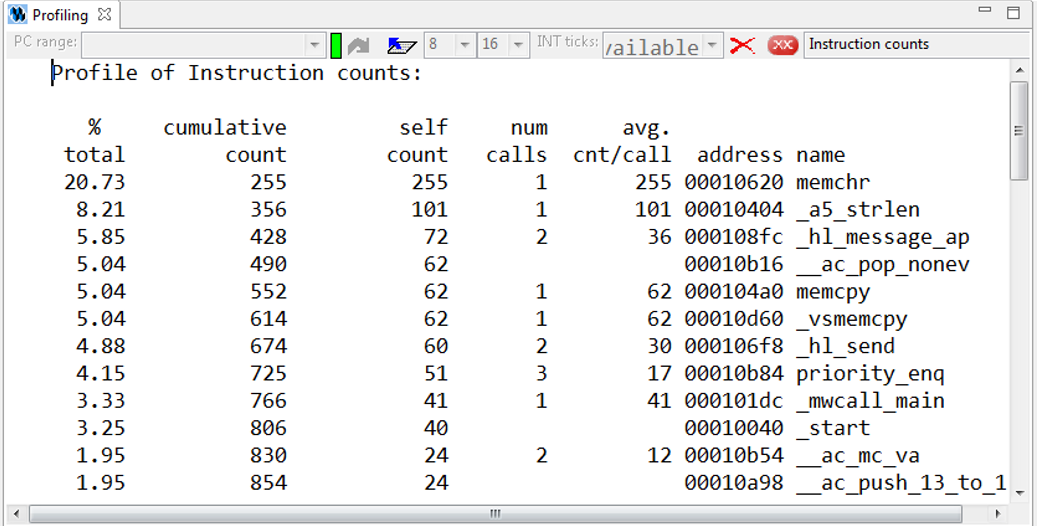
The Profiling window displays the corresponding of the number of executed instructions of the program with each function under the current debug window. From left to right, the total number of executions of function instructions in the total number of executions of the entire program instruction, the total number of executions of the accumulated instructions, the total number of executions of the functions, the number of times the function is called, the number of including functions, the address of the function, and the name of the function. Through the relationship between the instruction information and the function in the Profiling window, it is very convenient to analyze the program efficiency and find the shortcoming of the program performance.
Use this project as an example to continue to introduce the use of the Profiling window. The program is paused at the entrance of the main() function and the Profiling window opens. The main() function is the main object of performance analysis optimization. The content displayed in the Profiling window is some function information initialized by the processor before the main() function is executed. Click  in the Profiling window to clear the current information. If you click
  , nothing is displayed, and it indicates that the cleaning is successful. Set a breakpoint at the last statement of the main() function (either C statement or assembly statement), and click
  in the toolbar above the debug interface to let the program run until it hits the breakpoint. Click
  in the Profiling window, and only the information related to the main() function is displayed. Therefore, flexible setting of breakpoints, combined with the clear function, can perform performance analysis on the concerned blocks.
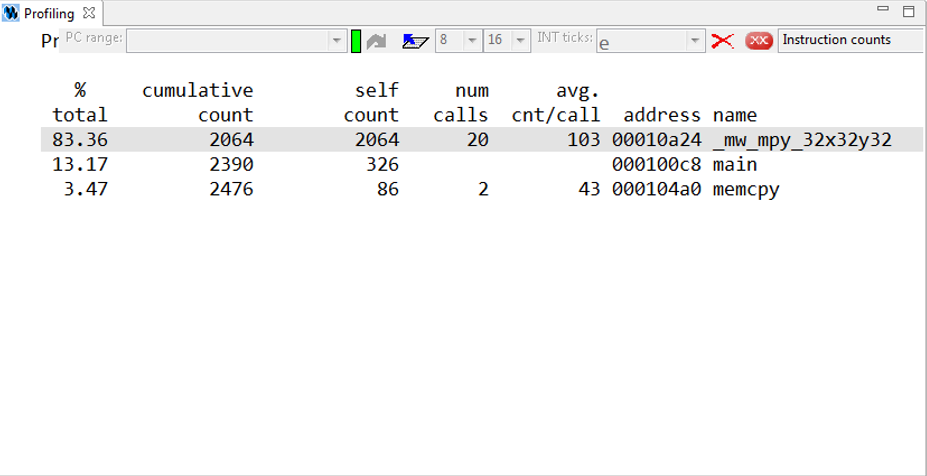
It can be seen that the multiplication library function _mw_mpy_32x32y32 in the main() function is called 20 times, and a total of 2064 instructions are executed, while the main() function itself executes only 326 instructions, and the memcpy function executes 86 instructions. It can be seen that the implementation of the multiplication function of the program consumes a large number of instructions, and the large number of instructions means that the processor spends a large number of computation cycles to perform multiplication operations. Therefore, multiplication is the shortcoming of current program performance. If you want to improve the performance of the program, you should consider how you can use fewer instructions and implement multiplication more efficiently.
Exercises
Enable MPY extension instrctions by setting Multiply Option -Xmpy_option = wlh1 in step 3, it implements multiplication more efficiently with fewer instructions. Redo steps 4 - 7 to analyze with the debugger’s Profiling function, observe the total number of instructions consumed by the main function, and compare it with the above Profiling result.
GNU Toolchain for ARC Processors
Purpose
- Learn the GNU Toolchain for ARC Processors
- Familiar with the GNU Toolchain for ARC Processors
- Familiar with the functions and usage of the GNU Toolchain for ARC Processors debugger
Requirements
The following hardware and tools are required:
- PC host
- GNU Toolchain for ARC Processors
- nSIM simulator or ARC board (EM Starter Kit / IoT Development Kit)
embarc_osp/arc_labs/labs/lab_core_test
Content
- Create a C project using GNU Toolchain for ARC Processors
- Import the code
CoreTest.cfromembarc_osp/arc_labs/labs/lab_core_test - Configure compilation options to compile, and generate executable files
- Start the GNU Toolchain for ARC Processors debugger to enter the debug mode
From two different perspectives of C language and assembly language, use the methods of setting breakpoint, single-step execution, full-speed executions, and so on combined with observing PC address, register status, global variable status, and profiling performance to analyze and debug the target program.
Principles
Use the GNU Toolchain for ARC Processors integrated development environment to create projects and load routine code. In the engineering unit, configure the compile option compilation routine code to debug and analyze the compiled executable file.
Steps
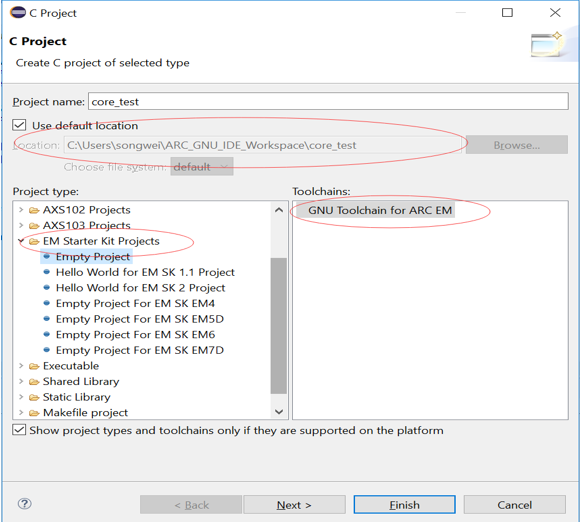
- Create a project
Open the GNU Toolchain for ARC Processors, create an empty project called core_test, and select ARC EM series processor.
- Import the code file CoreTest.c to the project demo
In the Project Explorer, right-click  , and select Import..
In the Implort wizard, select File system from the General tab, then click Next. As shown in the following figure, in the From directory fileld, type or browse to select the directory contain the file CoreTest.c. Recent directories that have been imported from are shown on the From directory field’s combo box. In the left pane, check a folder that imports the contents into the Workbench, and in the right pane check the file CoreTest.c.
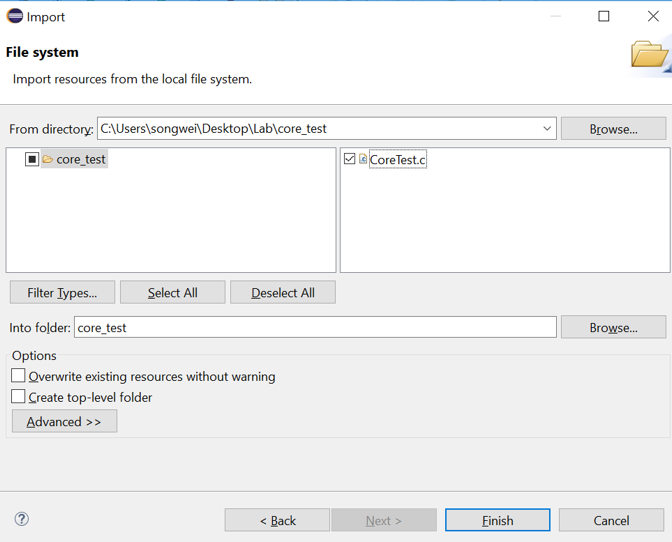
Click Finish when done, the file CoreTest.c is now shown in the one of the navigation views in the project core_test.
- Set compilation options
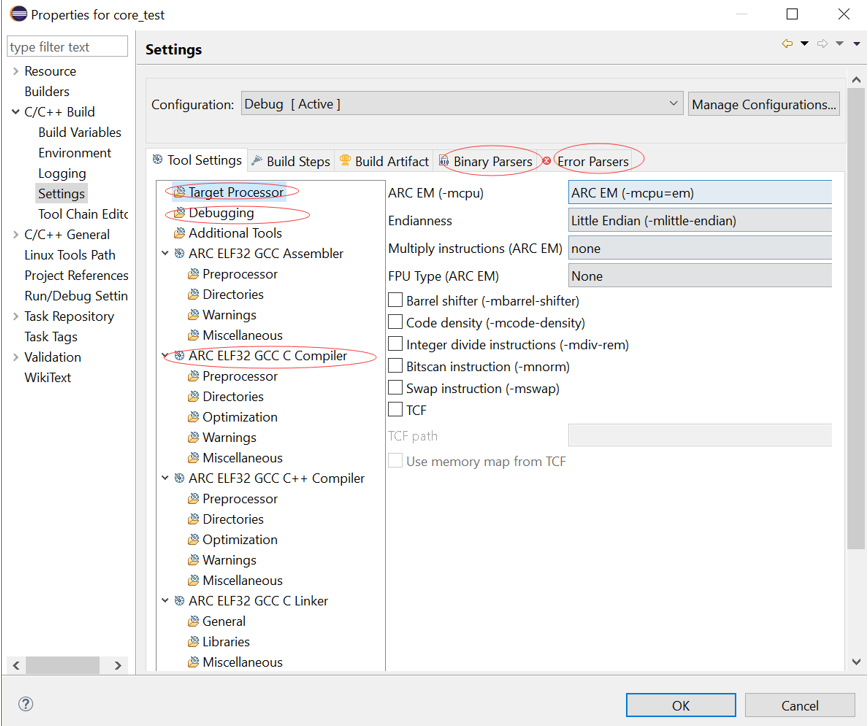
From the Project Explorer view, right-click the project core_test and choose Properties. Click C/C++ Build > Settings > Tool Settings.
The Tool Settings dialog opens.
Select Debugging to set the compiler optimization and debugging level. For example, set the optimization level to off optimization, and the debugging level is to load all debugging information.
Select Processor in the current interface to set the compile options corresponding to the target processor hardware attributes, such as the version of the processor, whether to support extended instructions such as shift, multiplication, floating-point operations, and so on whether to include Timer0/1.
In step 1, you built the project using the engineering template of EMSK, the corresponding necessary options have been set by default. If there is no special requirement, check the setting compile options in the All options column and click OK when done.
- Build project
In the Project Explorer view, select project core_test.
Click Project > Build Project or click  .
In the middle of the GNU Toolchain for ARC Processors main interface, you can see in the Console view the output and results of the build command. Click the tab to bring the view forward if it is not currently visible. If for some reason it is not present, you can open it by selecting Window > Show View > Console. When the message
.
In the middle of the GNU Toolchain for ARC Processors main interface, you can see in the Console view the output and results of the build command. Click the tab to bring the view forward if it is not currently visible. If for some reason it is not present, you can open it by selecting Window > Show View > Console. When the message Finished building target: Core_test.elf is displayed, the compilation is successful, and the compiled executable file Core_test.elf can be seen in the Project Explorer.
- Set debugger options
Click the Run > Debug Configurations… menu option to open the Debug Configurations dialog. Double-click C/C++ Application or right-click New to create a new launch configuration.
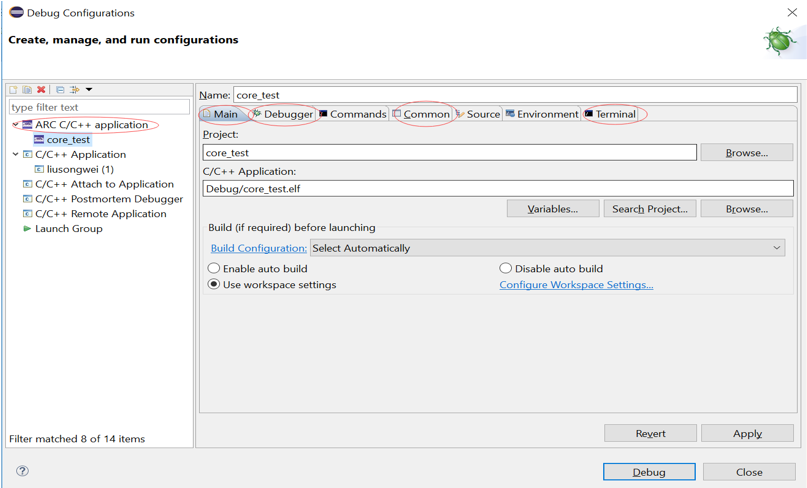
If a project is selected in the Project Explorer view all data is automatically entered, take a moment to verify its accuracy or change as needed. As you use nSIM simulator to simulate EMSK development board, you need to modify the settings of Debugger, Common, and Terminal (this is because nSIM cannot be called directly in GNU IDE. Still needs GDB Server for indirect calls). The specific settings are as follows:
- Set Debugger->Gdbserver Settings
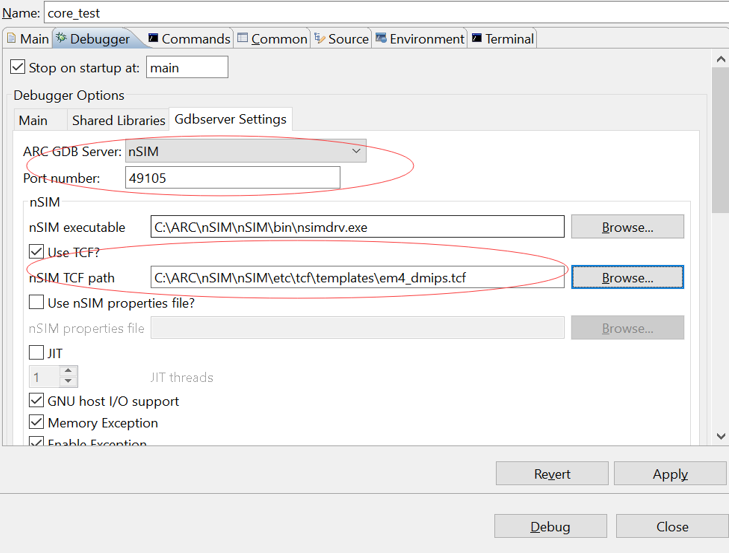
Select nSIM as the ARC GDB Server, and the default port number is 49105. Note that Use TCF is enabled. Otherwise, the nSIM cannot work normally. The TCF start file is under nSIM/nSIM/etc/tcf/templates (the default installation path). If you have downloaded the MetaWare IDE, the default nSIM path is C:/ARC/nSIM/nSIM/etc/tcf/templates, and you can select a TCF file from this folder (depending on the version of the board you are simulating and the kernel model), as shown earlier.
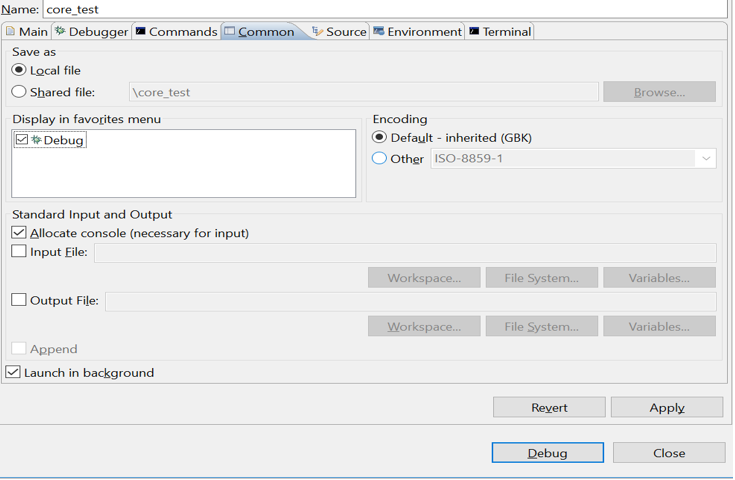
- Pay attention to Debug in Common
- Terminal settings
If you are using the EM Starter Kit, the terminal automatically selects the correct port number, and if you are using the emulator without a port, uncheck it as shown in the following figure.
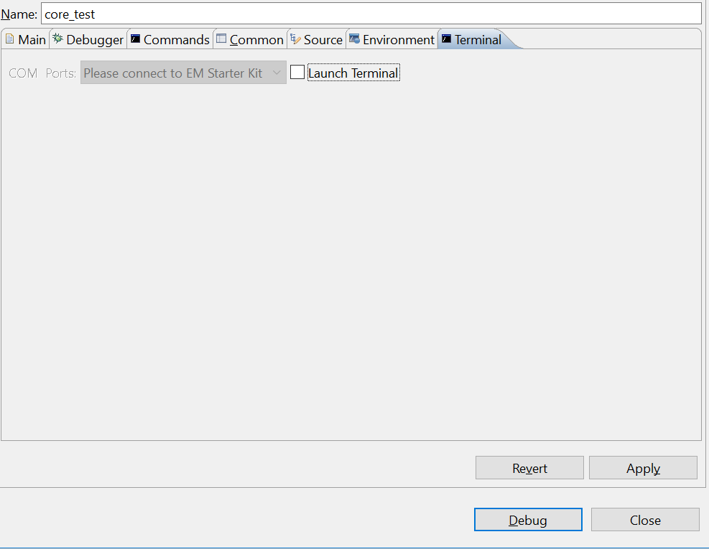
When you are done, click Debug to enter the debugging interface.
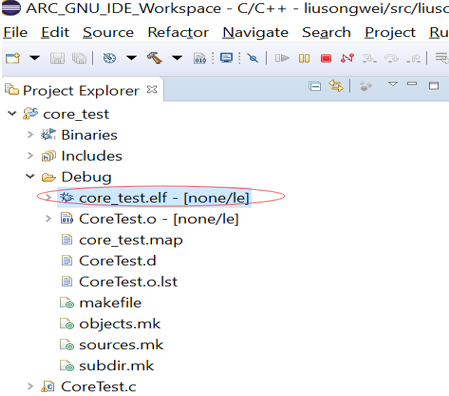
- Debug executable file core_test.elf
You may be prompted to switch to the Debug perspective. Click Yes.
The Debug perspective appears with the source code window, assembly code window, register window, global variable window, breakpoint window, function window, and so on.
In the C code window, right-click the code line number on the left side of the window, select Toggle Breakpoint or double-click the line number to set a breakpoint on. In the assembly code window, double-click a line of code to set a breakpoint on. A blue circle is seen indicating the breakpoint is set.
After the breakpoint is set, click Run > Resume or you can use the Resume button on the toolbar of the Debug view to run the program. The program runs directly to the nearest breakpoint. You can observe the current program execution and the relevant status information of the processor through the various windows as described in previous step. If you want to know more about the details of program execution and the instruction behavior of the processor, you can use the following three execution commands to perform single-step debugging. The icon can choose to step through a C language statement or an assembly instruction to match the status information of each window. It can be very convenient for program debugging. If you want to end the current debugging process, click . If you want to return to the main GNU Toolchain for ARC Processors page, click C/C++ .
- Code performance analysis using the debugger
Same as the code performance analysis method of MetaWare Development Toolkit.
For the use of these two IDEs, you can refer to the Help documentation in the respective IDE, or you can view the on-line documentation provided by Synopsys.